New
Workflow Intelligence Diagnostic: uncover friction, capacity leaks, and AI opportunities in 8 weeks.
The Quote-to-Bind Gap: Why MGAs Lose Accounts After the Quote Goes Out
.png)
The Quote-to-Bind Gap: Why MGAs Lose Accounts After the Quote Goes Out

The quote went out on time. The pricing was competitive. The submission was clean. And then nothing came back.
No explanation from the broker. No counter. The account just didn’t bind.
For most MGAs, this happens more than the numbers show. The quote-to-bind gap, the distance between a quote issued and a policy bound, is one of the most consequential and least examined metrics in specialty lines operations. It doesn’t announce itself as a problem. It shows up quietly, in premiums that were never written, in broker relationships that slowly drift toward other markets, in growth targets that stay just out of reach despite a healthy submission volume.
Tracking it precisely, and understanding what’s actually driving it, is where a lot of MGA operational improvement starts.
The quote-to-bind ratio is straightforward in concept: the percentage of quotes issued that result in a bound policy over a given period. If an MGA issues 100 quotes in a month and binds 22 of them, the ratio is 22%.
Industry average sits somewhere between 18 and 25%, depending on the line of business, the market cycle, and the complexity of the accounts being written. That range is wide enough to be nearly useless as a benchmark unless an MGA knows where it sits within it, and why.
Most don’t track it with that level of precision. Quotes get issued, some bind, some don’t, and the ones that don’t tend to disappear from the operational picture without much scrutiny. The submission moved on to another market, or the deal fell through, or the broker just stopped responding. The revenue impact gets absorbed silently.
The ratio matters because it’s a composite signal. A declining quote-to-bind number can mean pricing is off, turnaround is too slow, quote quality is inconsistent, or broker relationships are eroding. Each of those has a different fix. Without the metric in place, the underlying cause stays invisible.
The reasons an account doesn’t come back after a quote goes out are rarely mysterious, but they’re often undocumented. A few patterns account for the majority of the gap.
The quote-to-bind gap is difficult to diagnose partly because the data needed to see it clearly is rarely in one place.
When an account doesn’t bind, it typically gets closed out in the system and moves off the active queue. There’s no standard process for capturing why it didn’t come back. The broker didn’t respond. The account went elsewhere. Terms weren’t accepted. These outcomes get lumped together or logged inconsistently, and the pattern they form across dozens of accounts over a quarter never gets examined as a pattern.
The revenue impact compounds this. A policy that was never bound doesn’t appear as a loss on a report. It simply never appears at all. The premium is invisible because it was never written, which makes it easy to underestimate how much the gap is actually costing. An MGA issuing 200 quotes a month at an average premium of $40,000 and a bind rate five points below where it could be is leaving significant written premium on the table every single month, with nothing in the operational data pointing directly at it.
Without a tracked baseline, there’s no reference point for improvement. A ratio that moves from 21% to 24% over two quarters represents a meaningful operational gain, but only if someone was measuring it to begin with.
The quote-to-bind ratio isn’t a fixed number. It responds to specific operational changes, and most of the levers that move it are within an MGA’s direct control.
Most of the fixes outlined above are straightforward in principle. The difficulty is knowing which ones apply to a specific operation, and by how much.
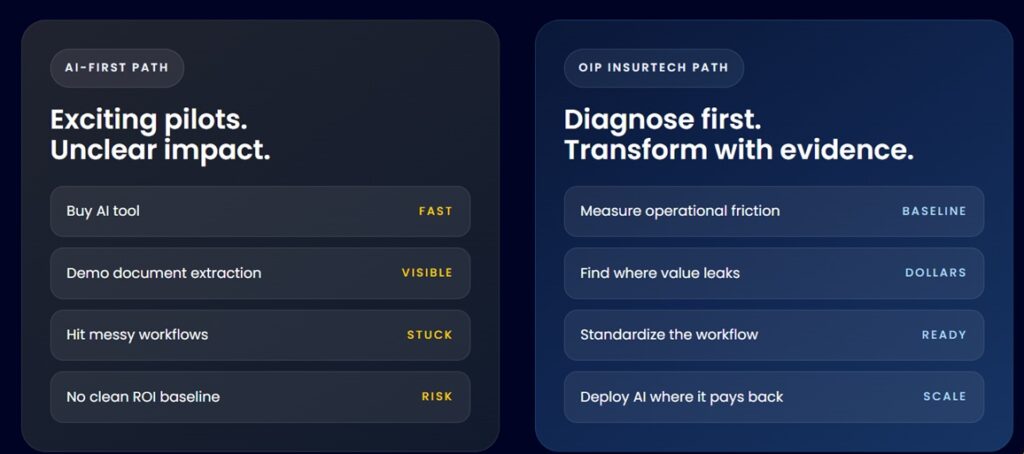
That’s the measurement problem. An MGA that suspects its quote-to-bind ratio is underperforming but doesn’t have precise data on where accounts are falling out, by line, by broker, by stage in the quoting process, is working on instinct rather than evidence. Instinct produces generic solutions. Evidence produces targeted ones.
The OIP Workflow Intelligence Diagnostic is built around this specific problem. In a structured four-week engagement, it maps the full submission-to-bind workflow, benchmarks performance against industry norms, and identifies the precise points where accounts and capacity are being lost. For the quote-to-bind ratio specifically, it delivers:
The output isn’t a general assessment. It’s a specific operational picture with a clear line between what’s happening now and what’s possible.
The quote-to-bind ratio tells a more complete story about MGA operational health than most teams give it credit for. It captures pricing competitiveness, turnaround performance, quote quality, and broker relationships in a single number. When it’s low, or declining, something in the operation is creating friction between a submission and a bound policy.
The accounts that don’t come back rarely explain why. That explanation has to come from the data, and building the measurement infrastructure to see it clearly is where the work begins.
MGAs that take the ratio seriously tend to find the same thing: the gap is larger than expected, and most of the causes are identifiable and fixable once the right operational picture is in place.
If your team is ready to see what that picture looks like for your operation, get in touch with the OIP team to learn more about the Workflow Intelligence Diagnostic.




.svg)

.svg)
.svg)